Because size matters !
Although “particle size” or “grain size” seems a basic petrophysical property of a material, it is quite a complex concept because it is a shape-dependent property. The size of a perfectly smooth and spherical object can relatively easy be described with its diameter. However, the shape parameter of non-spherical objects is by definition non-isotropic and the description of size becomes more problematic.
Many sizing techniques attempt to overcome this hurdle by working with approximating parameters such as the concept of the “equivalent spherical diameter” which describes the diameter of a sphere that exhibits an identical parameter value to that of the investigated non-spherical particle. The key understanding is that each grain-size technique measures a different and unique property of particles, which makes it very hard to compare data from different methods.
Analysis
Sieving analysis
A sieving analysis reports the weight proportion of material retained on each sieve of a sieving tower. A standard analysis uses following sieves: 4mm, 2mm, 1mm, 500µm, 250µm, 125µm and 63µm. The analysis can be performed on dry material but in case of much fine material, it is better to perform a wet sieving for optimal dispersion.
Laser diffraction
Laser diffraction is a quick and reliable method used to determine the particle size distribution of materials ranging from submicron- to millimeter size (ISO 13320). Laser diffraction measures particle size distributions by measuring the angular variation in intensity of light scattered as a laser beam passes through a sample dispersed in a suitable suspension fluid. The angular scattering intensity data is analysed to calculate the size of the particles using the Mie theory if the optical properties of the material are known. A simplified approach is to use the Fraunhofer approximation, which does not require knowledge of the optical properties of the sample. By this technique, many particles are analyzed to obtain a statistically significant particle size distribution. The particle size is reported as volume percentage equivalent spherical diameter.
Sedigraph settling
Qmineral can also determine particle size distributions by the use of Sedigraph settling. This technique is based on 2 basic principles: sedimentation based on Stokes’ law and the absorption of X-ray energy (Beer-Lambert law). These two principles are combined in the sedigraph and state that if all other variables are held constant, settling velocity of particles is proportional to particle size and the X-ray attenuation is proportional to mass concentration. By measuring the rate at which particles fall under gravity through a liquid having known properties the SediGraph determines the equivalent spherical diameter of particles. This technique is often successful for materials with a platy anisotropy but is unsuitable for coarser particles.
Image analysis
Another possibility for obtaining the size and shape of particles is Image Analysis. This technique is typically used to analyze high-resolution photographs of thin sections or polished sections. Based on the photographs, different size and shape parameters can be deduced of the particles. To a certain extent, it is also possible to analyze the size and shape of individual minerals.
Case study
Sample preparation and the influence on the analysis data
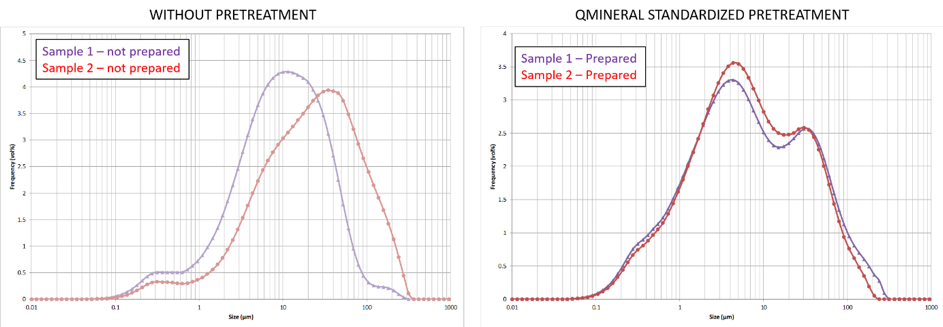
A short example below highlights the importance of sample preparation and the influence on the analysis data. In the left figure, the frequency distributions of two samples are shown which were analyzed with laser diffraction without proper treatment. From these data, it is clear that sample 2 (in red) has a coarser size distribution than sample 1 (in purple) and one easily concludes a major difference in grain-size between these two samples. In the right figure however, the frequency distribution of the same two samples is shown but now both samples were carefully prepared according to our standardized procedures and analyzed with appropriate measurement conditions. The data now clearly show that sample 1 and sample 2 have a highly similar grain-size distribution and also show multiple size populations.